Env-DATA interpolation methods
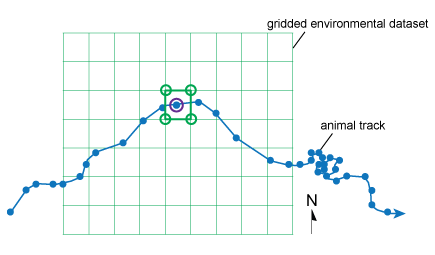
The Env-DATA Track Annotation Service in Movebank links animal tracking data to many different environmental datasets, each of which are provided at different temporal and spatial resolutions. To annotate tracking data, Movebank must use the values provided by the environmental data product for specific locations and times to calculate an estimated value of the variable for the location and time of each animal location. This process, of estimating unknown values from a set of known values within the same range, is called interpolation.
|
|
|---|---|
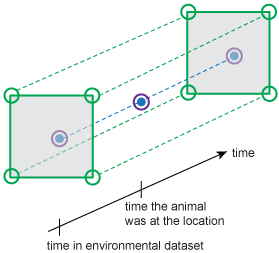
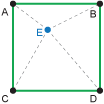
| We estimate conditions at a place (in purple) using the closest available conditions. | We estimate conditions at a time using the conditions provided directly before and after the time. |
Available interpolation methods
There are many methods for interpolating values from a dataset. Which method is best depends on the source dataset and on how you will use the values. In Movebank, we provide three different interpolation options that are commonly used for spatial data: nearest neighbor, bilinear, and inverse distance weighted. All of these methods assume that locations closer to each other in space and time will have more similar environmental conditions than locations farther from each other. Each of the methods uses a different way to give values at nearer locations more weight than values at more distant locations.
In addition to the general calculations, when Movebank annotates your data, it must also account for the curvature of the Earth and the difference in projections and formats used by different datasets. For products that provide changing variable values over time, Movebank uses the same calculations to interpolate in the temporal dimension to provide you with estimated values for the place and time of the animal's location. For some variables, a vertical interpolation is applied to estimate values at a specified distance above the Earth's surface.
Nearest neighbor interpolation
In nearest neighbor interpolation, the estimated value is simply the same value as that of the nearest data point.
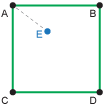
Here the nearest value provided by the dataset is at location A, and so we use the elevation at A as the estimated elevation at location E.
When to use: For conditions that are described by categories, such as land use, for which we can't calculate averages as required for other methods. This method could also be useful when it is best just to take the closest available measurement, for example if the environmental data product contains many data gaps, or if the requested information is highly variable in space.
Advantages: This method is simple and easy to explain, and doesn't require that any new values are calculated from the original dataset.
Disadvantages: This method considers only one value in the dataset.
Missing data: If the closest value in the environmental dataset is a "missing data" value, Movebank annotates the value of the next closest point, considering up to four locations in space and up to the two nearest timepoints. If all of these values are missing, you will receive the result NaN. This method is used to maximize the number of valid results.
Bilinear interpolation
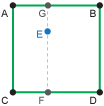
Bilinear interpolation estimates the value using the surrounding values, with these values weighted based on their distance to the location for which you are calculating the new value, so closer values are given a greater weight than those from farther away. To do this, we calculate a linear interpolation in the x-direction and then in the y-direction (hence the name bilinear interpolation). In the illustration below, this is equivalent to estimating the value at points G and F (x-direction) and then using those values to estimate the value at E (y-direction).
For gridded datasets, Movebank currently uses environmental data from the four locations nearest the animal location to calculate the annotation. If the values change over time, Movebank uses the environmental data from directly before and after the time of the animal location—this temporal interpolation (unilinear) will actually be made using a linear (inverse distance weighted) calculation.
When to use: For environmental conditions described by real numbers and provided in a regular grid in space and time, such as temperature estimates that are available for every degree of latitude and longitude, every six hours.
Advantages: This method is simple and easy to explain, works for many kinds of datasets, and considers multiple values near the location of interest.
Disadvantages: This method cannot be used for conditions described by categories or for values that are not provided in regular intervals.
Missing data: If any of the four closest values in the environmental dataset is a "missing data" value, Movebank annotates the value as NaN. If the variable changes with time, Movebank will consider the four nearest values at the two closest timepoints (eight values total) and return NaN if any of these is a nodata value.
Inverse distance weighted interpolation
Inverse distance weighted interpolation estimates the value using the surrounding values, using the inverse of the distance to each surrounding value as a weighting factor, so closer values are given a greater weight than those from farther away. For gridded datasets, Movebank currently uses environmental data from the four locations nearest the animal location to calculate the annotation. If the values change over time, Movebank uses the environmental data from directly before and after the time of the animal location.
When to use: For conditions described by real numbers, not restricted to those provided in regular grids.
Advantages: This method is one of the most commonly used in environmental sciences. It is simple and easy to explain, works for all numeric datasets, and considers multiple values near the location of interest.
Disadvantages: This method cannot be used for conditions described by categories.
Missing data: If any of the four closest values in the environmental dataset is a "missing data" value, the missing values will be ignored and not included in the calculation of the annotated value. Only if all values within this interpolation range are missing will you recieve the result NaN.
Choose an interpolation method
Generally, categorical variables—such as land use types or quality control codes—cannot be interpolated between several different values, because an average of the values would have no meaning. For these variables we allow only nearest neighbor interpolation. For variables that were generated by a model and are therefore provided on a full grid without missing values—such as the NARR or ECMWF weather models, NASA's Global Precipitation Measurement and the Oregon State University ocean net primary productivity dataset—we recommend a bilinear interpolation. For observation-driven variables, such as MODIS products, we recommend the inverse distance weighted method.
Handle missing data values
Missing data can result from nodata values in the original environmental dataset, records without locations in your tracking data, or tracking data locations that occur outside the spatial or temporal range of the environmental dataset. Each environmental dataset provides a particular value to indicate missing data. We include this "nodata" value in the readme file we provide with each annotated data file. When the nearest neighbor method is used, if the nearest values for an annotated location are missing data values, you will receive the nodata value from the source dataset for that record. However, when interpolating using several points, we ignore these nodata values and the missing data they represent. The result is that for bilinear interpolation, if any of the surrounding four values is missing, the annotated result for that location will be NaN (and not a number). For inverse distance weighted interpolation, the missing values will not be included in the interpolated weighted average. This provides the advantage for this interpolation method in an observation-driven environment—a value will be provided even if some points around the location are missing. Only if all neighboring values are missing will you recieve the result NaN.
Vertical interpolation
Weather models accessed by Env-DATA provide estimates of some environmental conditions—such as temperature, cloud cover, or humidity—at various heights above the Earth's surface. In these cases, it is also possible to use a vertical interpolation. The vertical interpolation will estimate values for the variable at the height (in meters) provided in the "height above ellipsoid" or "height above mean sea level" attribute, if available in the tracking dataset.
The weather models calculate changes in weather conditions by height at different isobaric levels ("layers" above the land surface at which the atmospheric pressure is the same) rather than at geometric heights (such as 100 m amsl). Atmospheric pressure decreases with altitude, but is not linearly related to the geometric height above land surface. However, the geopotential height—a variable also provided by the weather models—can be used to convert between height in meters and the atmospheric pressure level for a given place and time. Movebank uses two methods for vertical interpolation, described below. In both cases, all values stored in "height above ellipsoid" are converted to "height above mean sea level", and then the amsl values are used in calculations. It is important to make sure that your values are stored in the correct variable in Movebank (“height above ellipsoid” or “height above msl”) so that vertical interpolations are calculated correctly—you may need to contact your tag provider to find out which of these the values in your data represent.
Nearest neighbor: Movebank converts the geometric height (from "height above ellipsoid" or "height above mean sea level" in the tracking data) to the atmospheric pressure level, identifies the nearest pressure level available in the source data, and provides the value for that level.
Linear interpolation (inverse distance weighted): Movebank converts the geometric height (from "height above ellipsoid" or "height above mean sea level" in the tracking data) to the atmospheric pressure level, identifies the two pressure levels in the source data that this height falls between, obtains the values for those two pressure levels, and uses a linear (inverse distance weighted) interpolation, measuring distance in pressure units, to calculate the interpolated value.
Missing data and locations near the land surface: In case of missing or inaccurate values in the "height above ellipsoid" or "height above mean sea level" attribute, and for records where the animal is near the land surface, we recommend that you also annotate a similar surface level variable, or the same variable for 2, 10, or 30 meters above the surface (options vary by provider), so that you have a second estimate. In cases where animals are at or near the ground, you may get values of "NaN" using vertical interpolation because the calculations place your animal underground.
References
Dodge S, Bohrer G, Weinzierl R, Davidson SC, Kays R, Douglas D, Cruz S, Han J, Brandes D, Wikelski M (2013) The Environmental-Data Automated Track Annotation (Env-DATA) System: linking animal tracks with environmental data. Movement Ecology 1:3. https://doi.org/10.1186/2051-3933-1-3
Li J and Heap AD (2011) A review of comparative studies of spatial interpolation methods in environmental sciences—performance and impact factors: Ecological Informatics 6: 228–241.
Lam NS-N (1983) Spatial interpolation methods: a review: Cartography and Geographic Information Science 10: 22.
Env-DATA Track Annotation Service
Interpolation methods